
Hello!
Ask me any question about Lympik.
Please be as specific as possible so I can help you better.
Track configuration
Click on 'Configure track' in your activity to be taken to the following view:
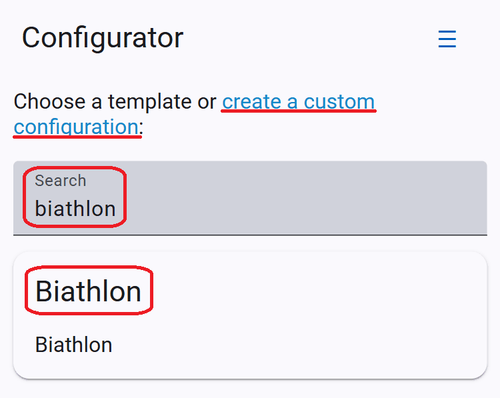
Here you can decide if you want to choose between a pre-created template (recommended) or if you want to configure a custom-made track. In the following steps the template will be described in detail. If you want to lern more about the custom solution, click on the following link: Custom Track Configuration
You can now choose between the template "Running" or "Running & Shooting Basic":
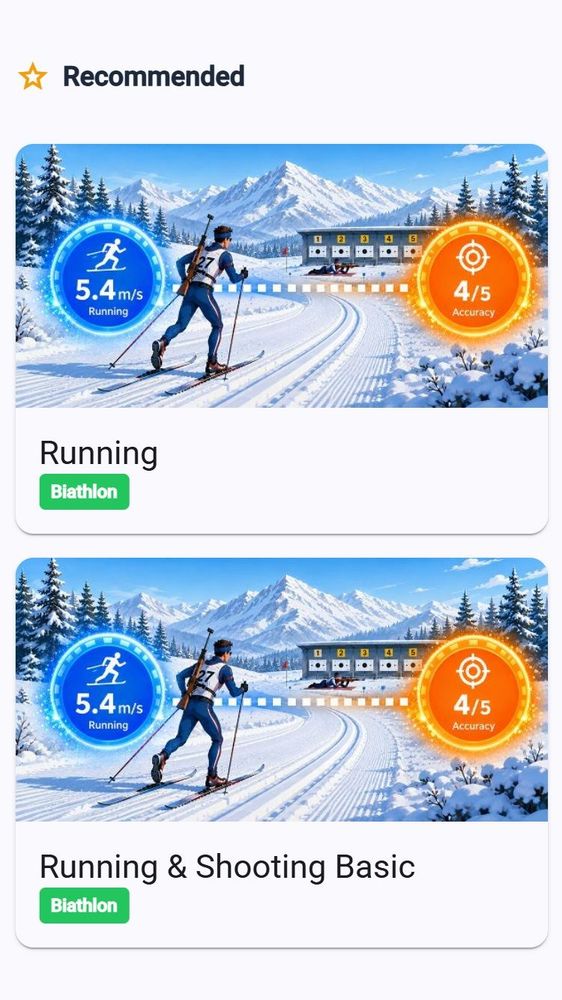
Running & Shooting Basic
this templates offers multi-lap biathlon analysis with shooting-range detection, configurable splits and speed traps.
What to configure
- Start gate - where each lap begins (re-crossed every lap)
- Range Enter / Range Exit - gates around the shooting range. Used to detect when an athlete enters and leaves the range.
- Finish gate - separate gate that marks the end of the race (place it at a distinct physical location from the start gate).
- Splits (add any number) - additional timing gates placed between the start and the range. Each adds a section and a split column to the results.
- Speed traps (add any number) - pairs of gates placed between the start and the range. Each yields entry, average, and exit speed for that section.
- All shooting detection (range entry/exit, shot detection) is automatic - no shot-by-shot configuration needed.
What you get
Per lap and per athlete:
- running - time spent skiing (range time excluded).
- range - time inside the range (enter -> exit).
- shooting - time from shooting-start to shooting-end.
- time to first shot - delay between starting to shoot and the first shot detected.
- miss - missed targets (manually entered).
- lap time - total time from start gate to range exit.
- run speed - average speed during the running portion (m/s).
- distance - distance covered during the running portion.
- section i / split i - per split timing for each split gate added.
- entry i / avg i / exit i - per speed trap measurements for each speed trap added.
Across all laps:
- bar chart: average running speed per lap, grouped by athlete
- filter: scope the table and chart to selected athletes and laps
- motion data explorer: replay the trajectory with speed overlay
- video data explorer: synch video review per lap
Configuration
After selecting the desired template, you will be taken to the Track Configuration screen.
The first step is to position the gates according to your requirements. You can either:
- Drag the gate circles directly to the desired location, or
- Click the gate icons at the top of the screen and enter the coordinates manually to place the gates precisely.
Please note that each gate has a defined direction, indicated by the arrow between the two gate circles. A gate will only be triggered when the athlete passes through it in the direction shown by the arrow. If you want gates to be triggered from both directions, click the Settings icon (cogwheel) in the top-right corner and uncheck the "Unidirectional Gate Crossing" option. Once this setting is disabled, athletes can trigger gates regardless of the direction in which they pass through them.
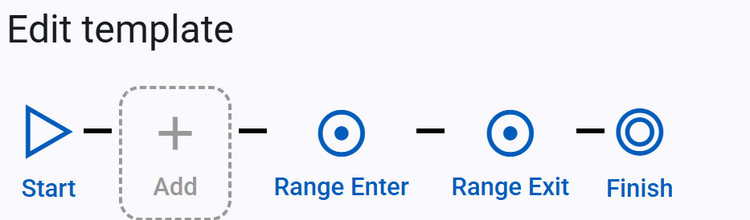
By clicking on the "+" you can add as many splits or speed traps as desired.
After uploading the Oculus data (this will be described in the next step), you will see the datasets in the track configuration:
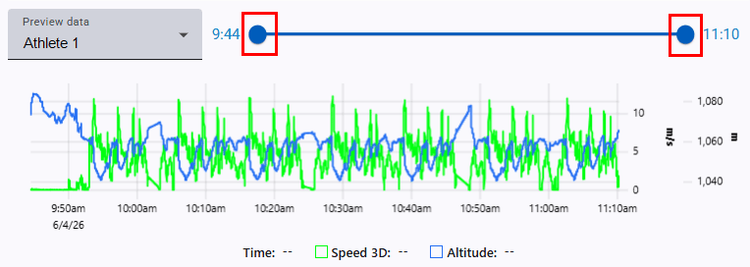
Under Preview Data, you can select the athlete whose data you would like to edit.
To trim the dataset, click and drag the handles at the beginning and end of the data range. This allows you to select only the portion of the dataset that you want to analyze.
Attention: If a data set is shortened, this not only affects the view in the map, but also the data used for the calculation - for a calculation it is necessary that all gates have been passed through and thus the run has been completed.
Once you have finished configuring the track, click Process to generate the results and proceed to the Results Overview screen.